The ReMi Shear-Wave Velocity Method
Obtain site-specific NEHRP/IBC Vs30 site classification without a
test boring!
The ReMi method is useful in determining:
- Site-specific earthquake response
- Liquefaction potential
- Soil compaction
- Subsurface geology
The refraction microtremor (ReMi) method provides an effective and
efficient means to acquire general, one-dimensional, information
about large volumes of the subsurface with one equipment setup. The method can
be used to estimate shear wave velocity profiles and provide
site-specific NEHRP and IBC Vs30 soil classification data.
Testing is performed at the ground surface with no need for a specially cased borehole. Also, since this method measures ambient seismic “noise” it can be conducted in seismically noisy areas such as construction zones and urban environments. The data acquisition consists of setting up a linear array of geophones and recording ambient seismic “noise”. A shear-wave dispersion curve is derived and used to model subsurface shear-wave velocity. The effective depth of investigation is related to the length of the geophone array and the frequency response of the measurement system.
The ReMi method (Louie 2001) is based on spectral analysis of
surface waves (SASW) and multi-channel analysis of surface waves
(MASW) as first described to the earthquake engineering community (Nazarian
and Stokoe 1984). With SASW, shear-velocity profiles are obtained
from Rayleigh-wave phase velocities interpreted from the seismic
waveforms. The SASW interpretation is performed in the frequency
domain and assumes that the most energetic arrivals are Rayleigh
waves. Applying a time-domain velocity analysis allows for
separation of Rayleigh waves from body waves and other coherent
noise. The ReMi method transforms the time-domain velocity results
into the frequency domain and combines many arrivals over a long
period of time allowing for easy recognition of dispersive surface
waves.
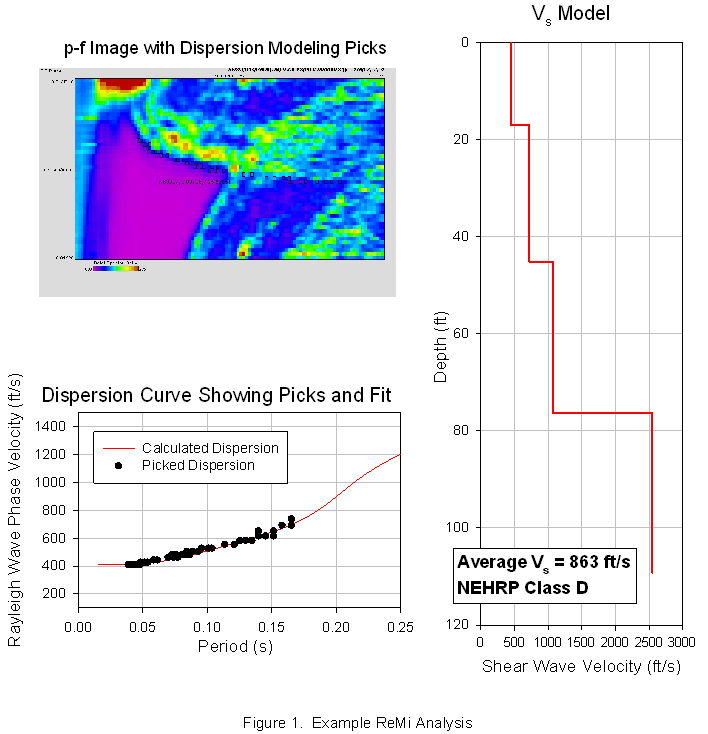
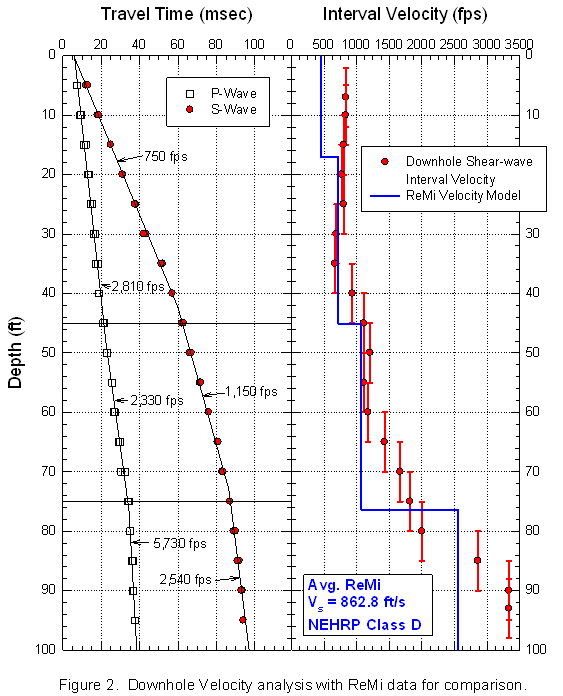
This dispersion is displayed in p-f space where dispersion curve picks can be made. These picks are used to model the subsurface geology and seismic velocities. Examples of the p-f image, the dispersion curve fitting, and the shear-wave velocity model are shown in Figure 1. The data in Figure 1 were collected in the vicinity of a down-hole survey. Figure 2 contains a travel time graph and interval velocity profile from a down-hole study. The shear-wave velocity model from a ReMi analysis conducted in the vicinity of the boring is included on the Interval Velocity plot.
Testing is performed at the ground surface with no need for a specially cased borehole. Also, since this method measures ambient seismic “noise” it can be conducted in seismically noisy areas such as construction zones and urban environments. The data acquisition consists of setting up a linear array of geophones and recording ambient seismic “noise”. A shear-wave dispersion curve is derived and used to model subsurface shear-wave velocity. The effective depth of investigation is related to the length of the geophone array and the frequency response of the measurement system.
 |
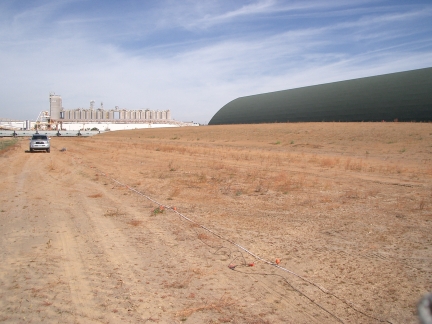
| ReMi Data acquisition at a grain storage facility. |
This dispersion is displayed in p-f space where dispersion curve picks can be made. These picks are used to model the subsurface geology and seismic velocities. Examples of the p-f image, the dispersion curve fitting, and the shear-wave velocity model are shown in Figure 1. The data in Figure 1 were collected in the vicinity of a down-hole survey. Figure 2 contains a travel time graph and interval velocity profile from a down-hole study. The shear-wave velocity model from a ReMi analysis conducted in the vicinity of the boring is included on the Interval Velocity plot.


